Remote Sensing-Based Spectral Index Mapping of Chittagong District (2024)
Published:
This project explores the spatial distribution of vegetation, built-up areas, surface water, and bare land across Chittagong District, Bangladesh, using Remote Sensing and GIS.
Four indices—Normalized Difference Vegetation Index (NDVI), Normalized Difference Built-up Index (NDBI), Normalized Difference Water Index (NDWI), and Normalized Difference Bareness Index (NDBaI)—were used to characterize different land-surface features in 2024.
1. Normalized Difference Vegetation Index (NDVI)
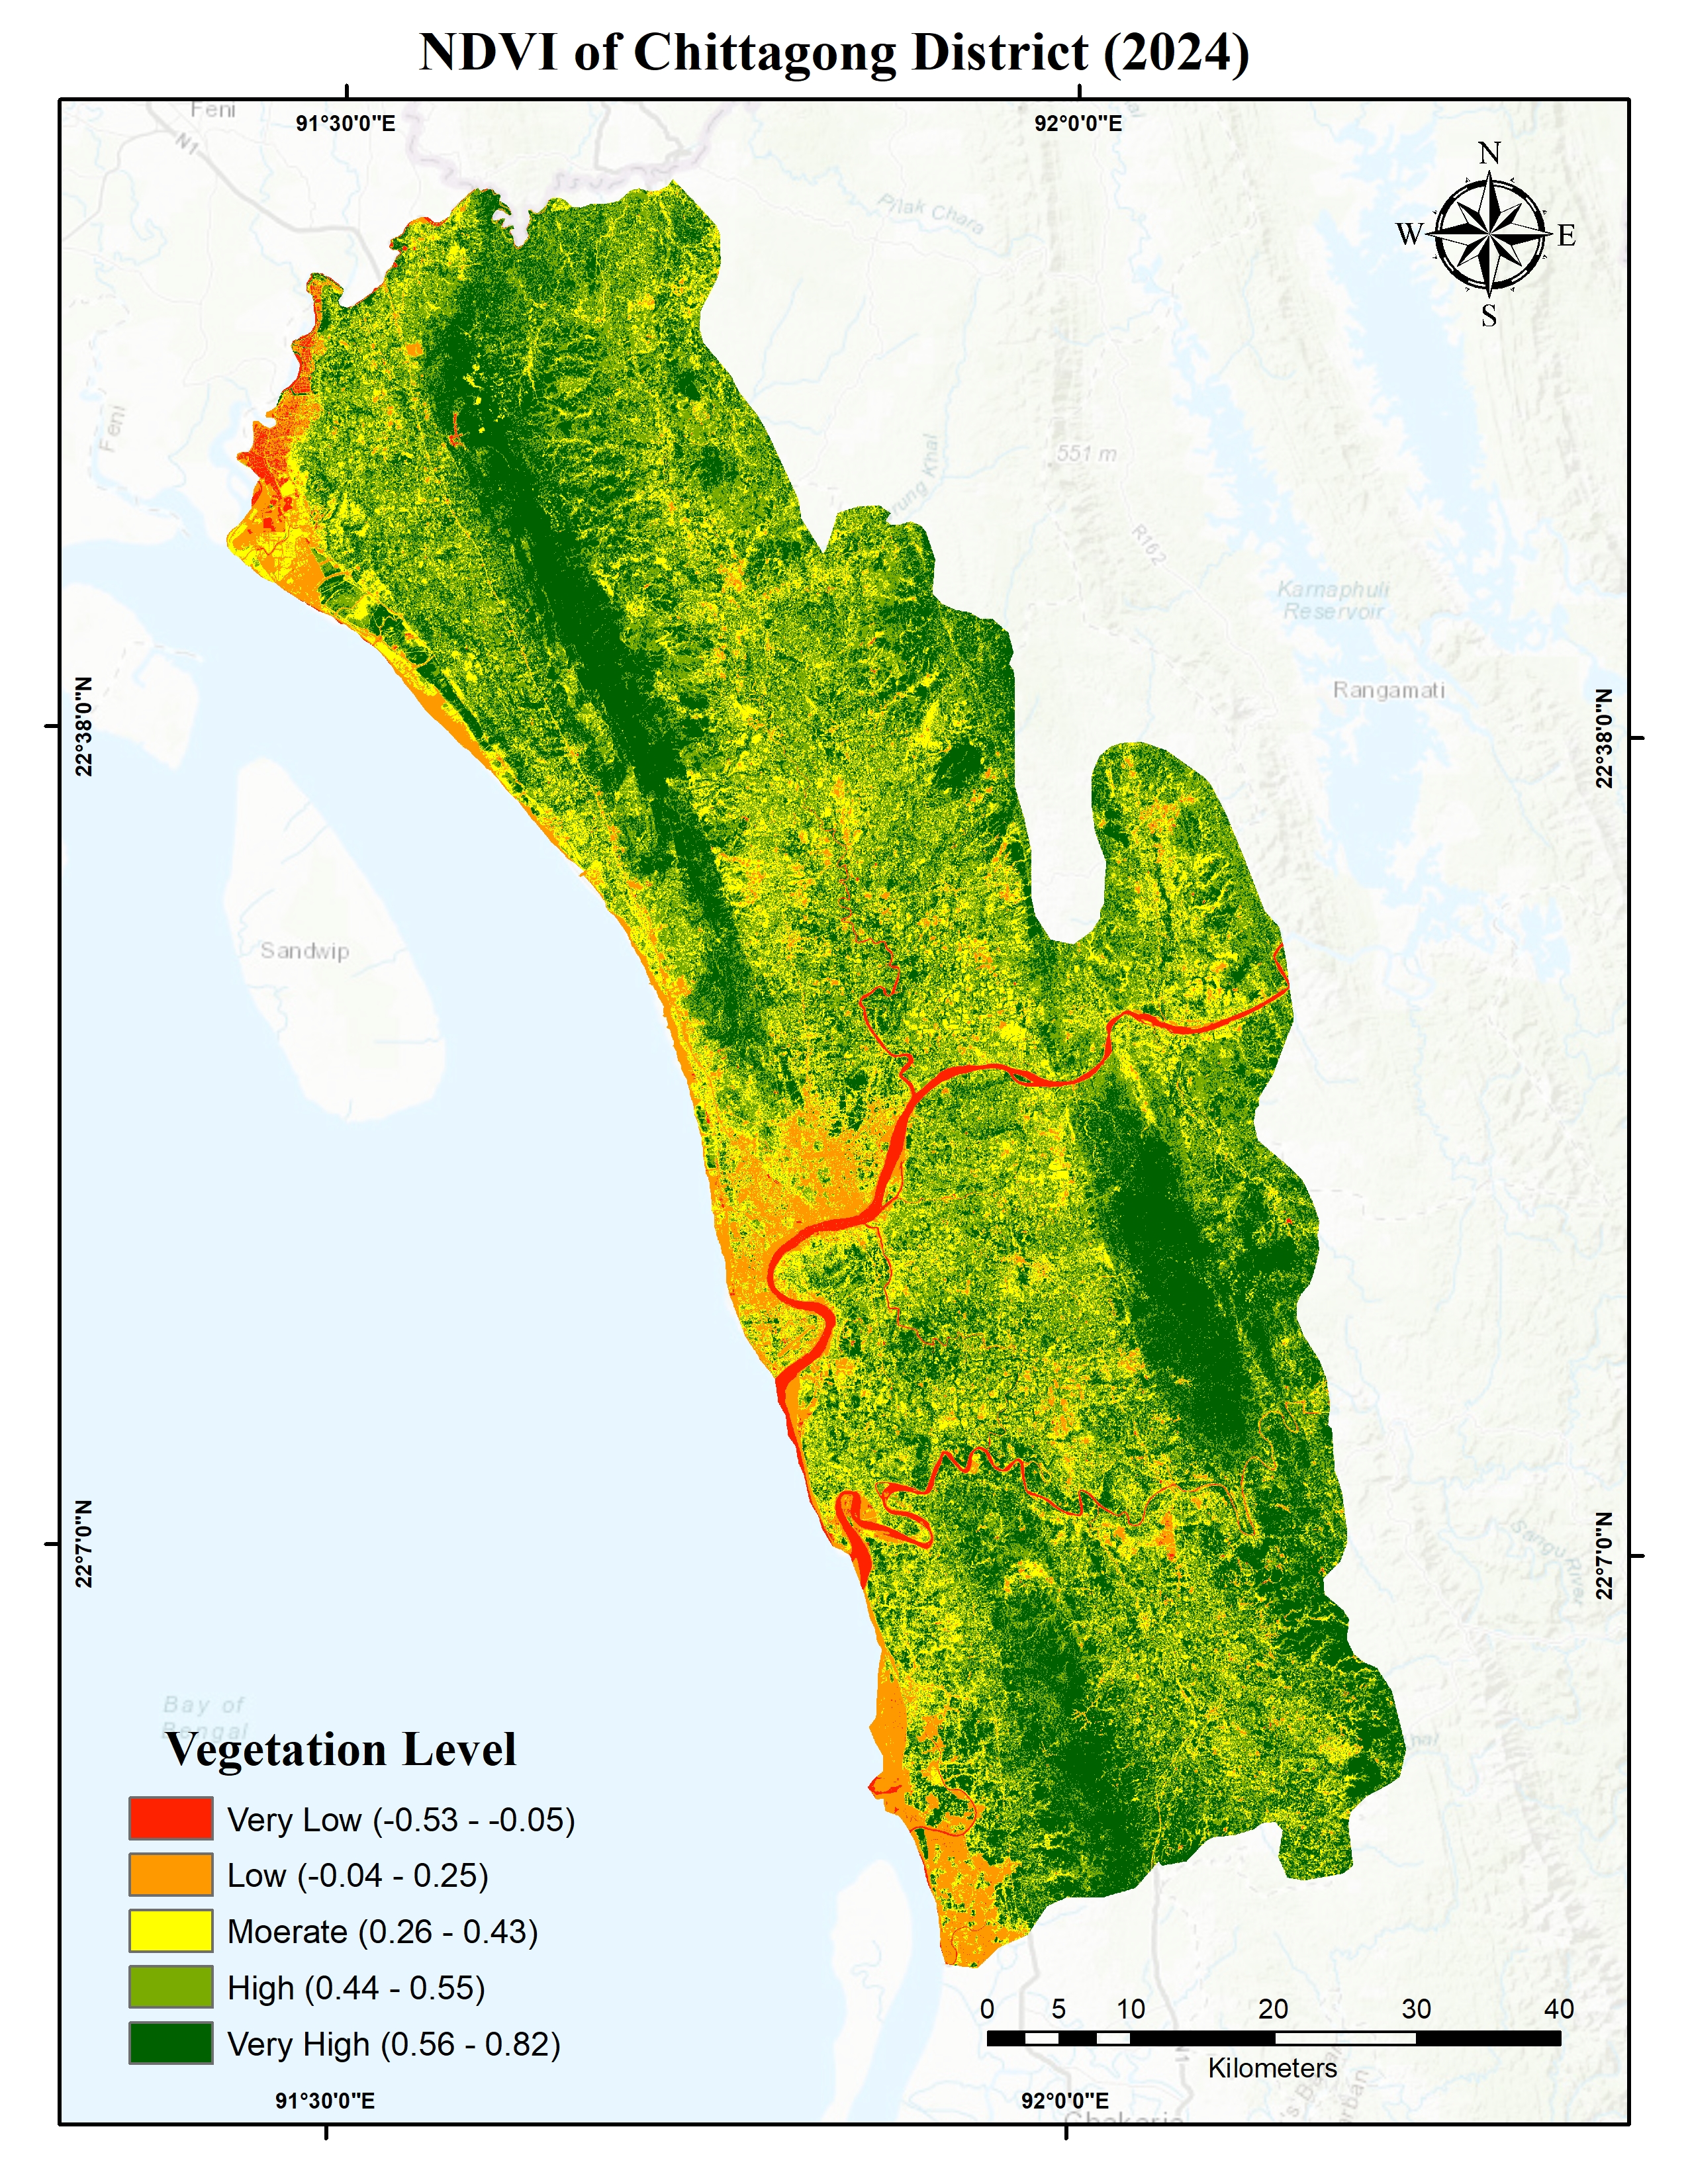
NDVI is a spectral index used to assess vegetation greenness and density by comparing near-infrared (NIR) and red reflectance. Higher positive values generally indicate denser vegetation, whereas lower or negative values may represent urban areas, exposed surfaces, or water.
The map shows substantial spatial variation in vegetation cover across Chittagong District. Areas classified as having very high vegetation levels are particularly visible across the northern and eastern parts of the district, while lower NDVI values occur in portions of the coastal belt, around river channels, and in other relatively sparsely vegetated or developed areas.
2. Normalized Difference Built-up Index (NDBI)
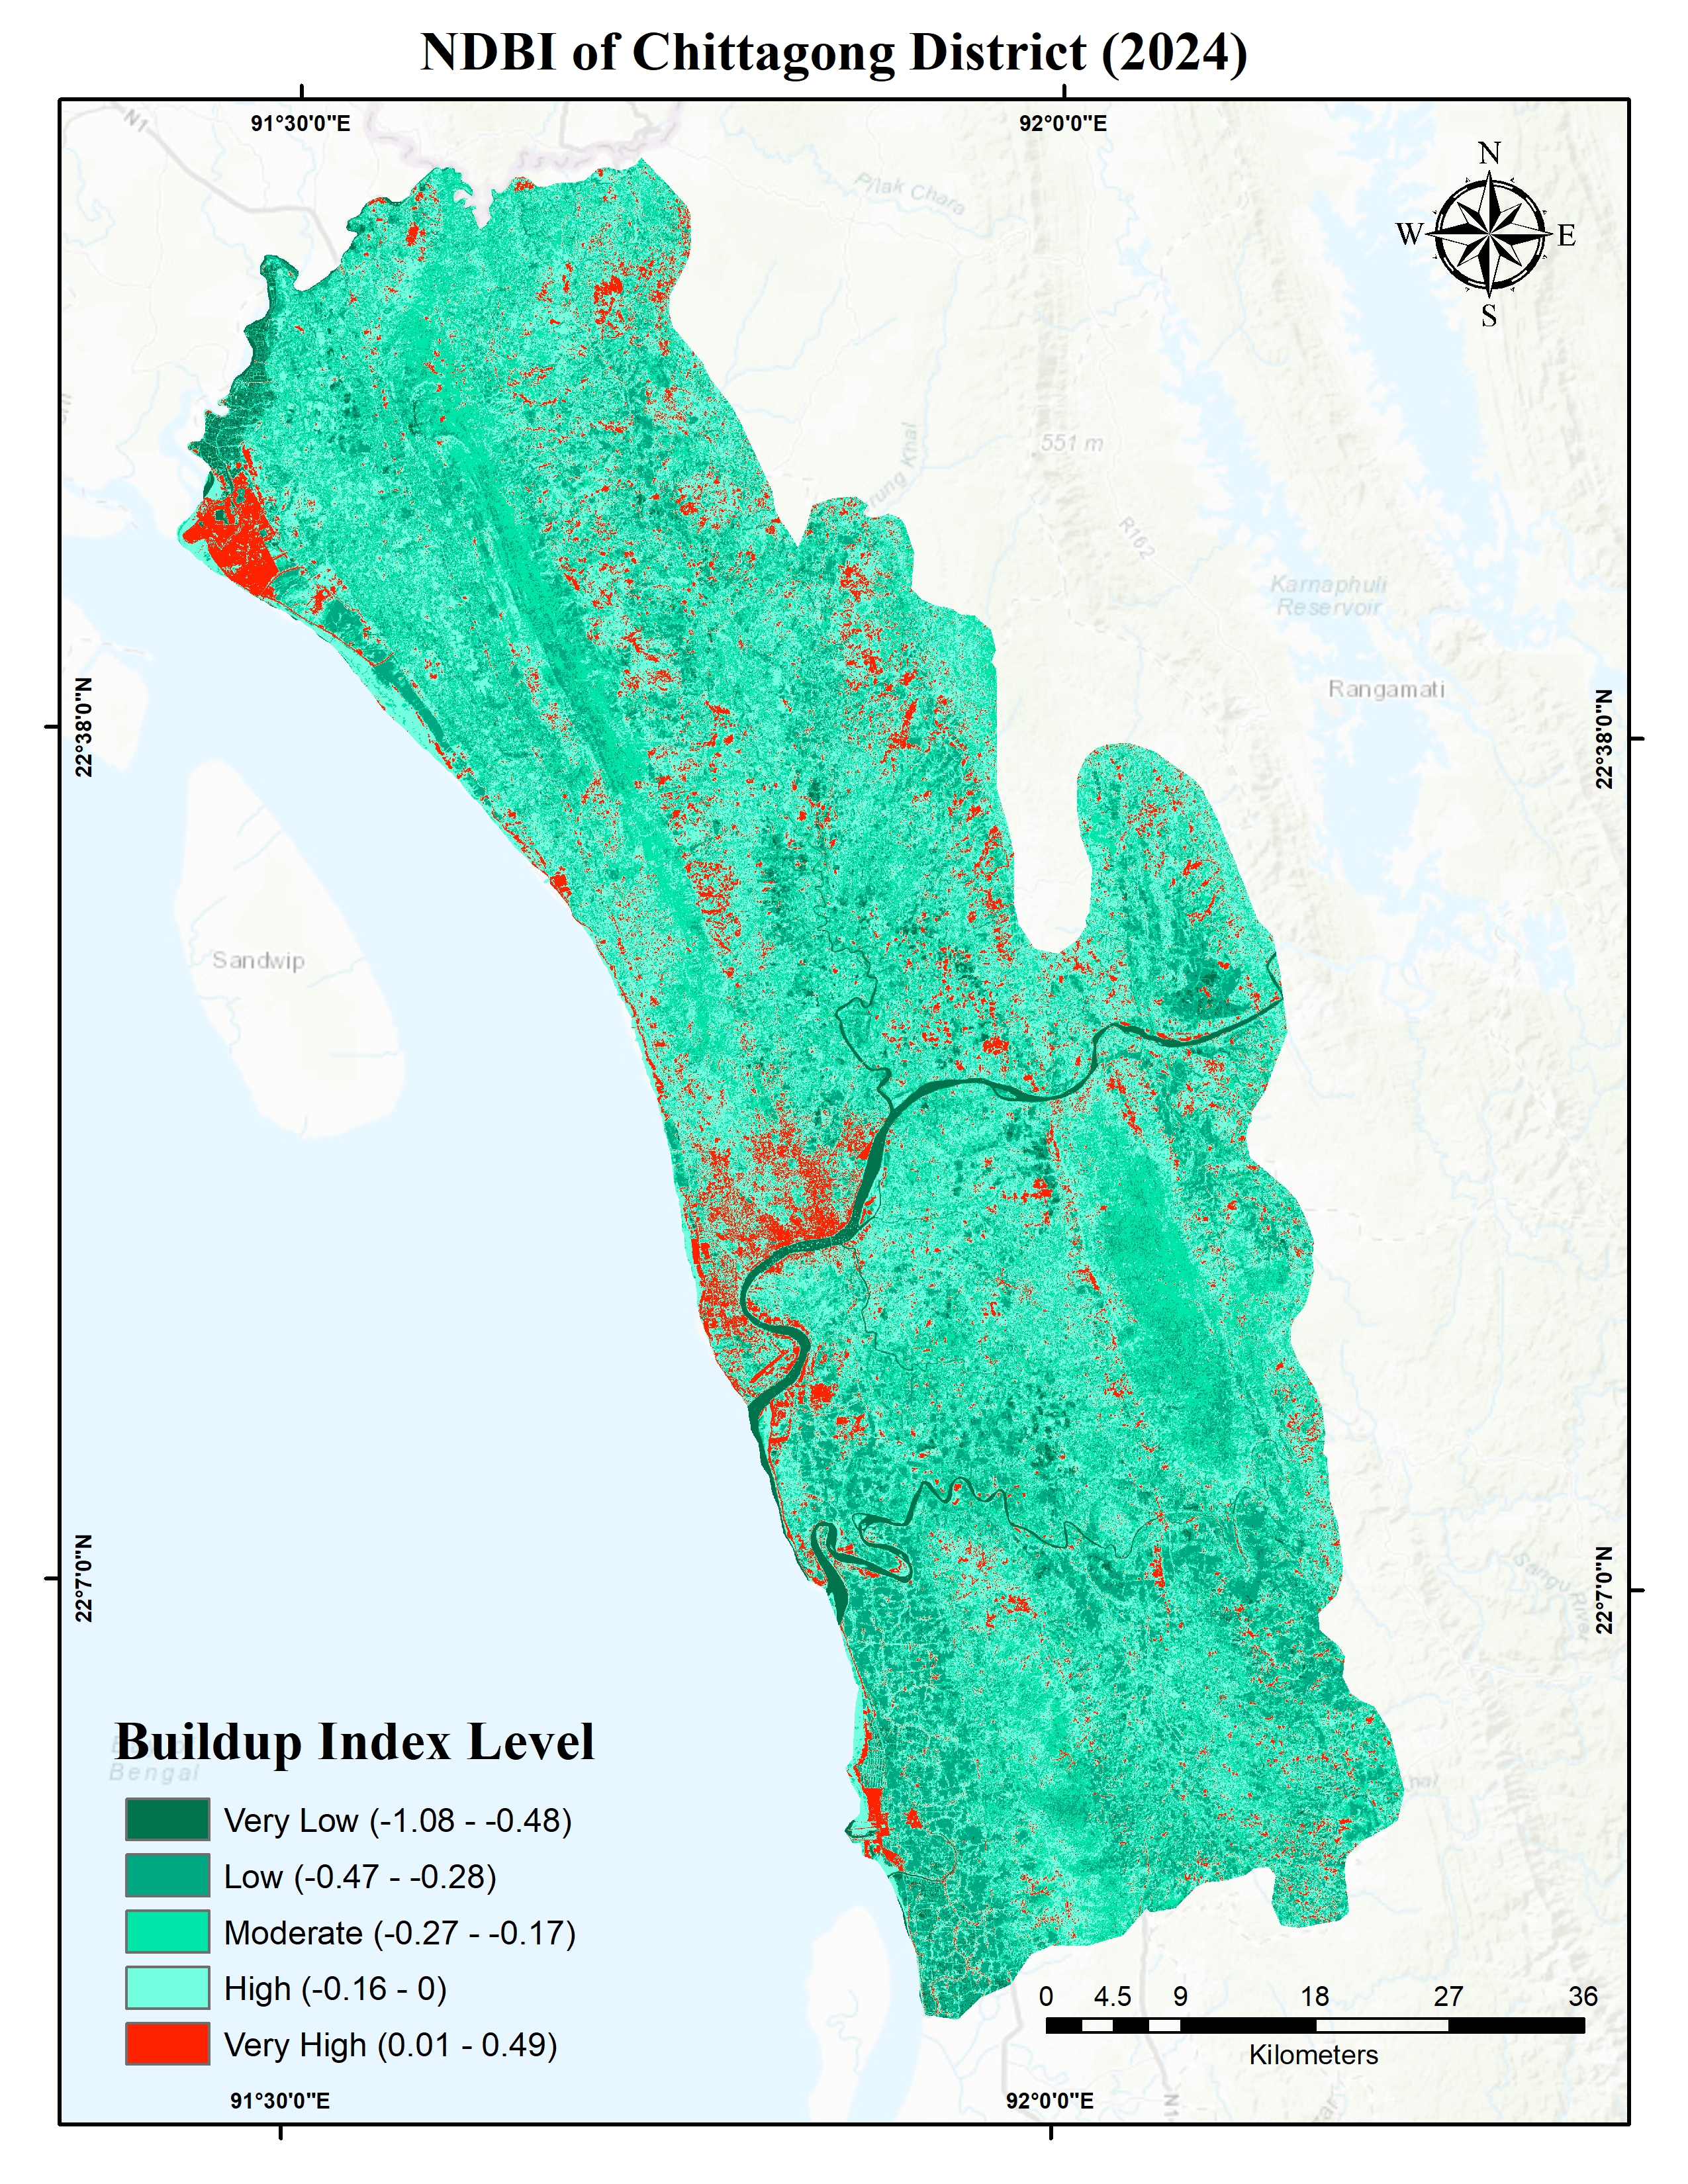
NDBI is used to identify and characterize built-up surfaces by comparing shortwave-infrared (SWIR) and near-infrared (NIR) reflectance. It is commonly applied in urban expansion studies, built-up area mapping, and the assessment of urban land-cover change.
The NDBI map helps reveal the spatial distribution of built-up surfaces across Chittagong District. Areas with relatively high NDBI values may indicate urbanized or developed land, while lower values can be associated with vegetation and other land-cover types. However, bare soil and some other exposed surfaces can also exhibit high NDBI values, so the index should not be interpreted as a definitive built-up classification without additional evidence.
3. Normalized Difference Water Index (NDWI)
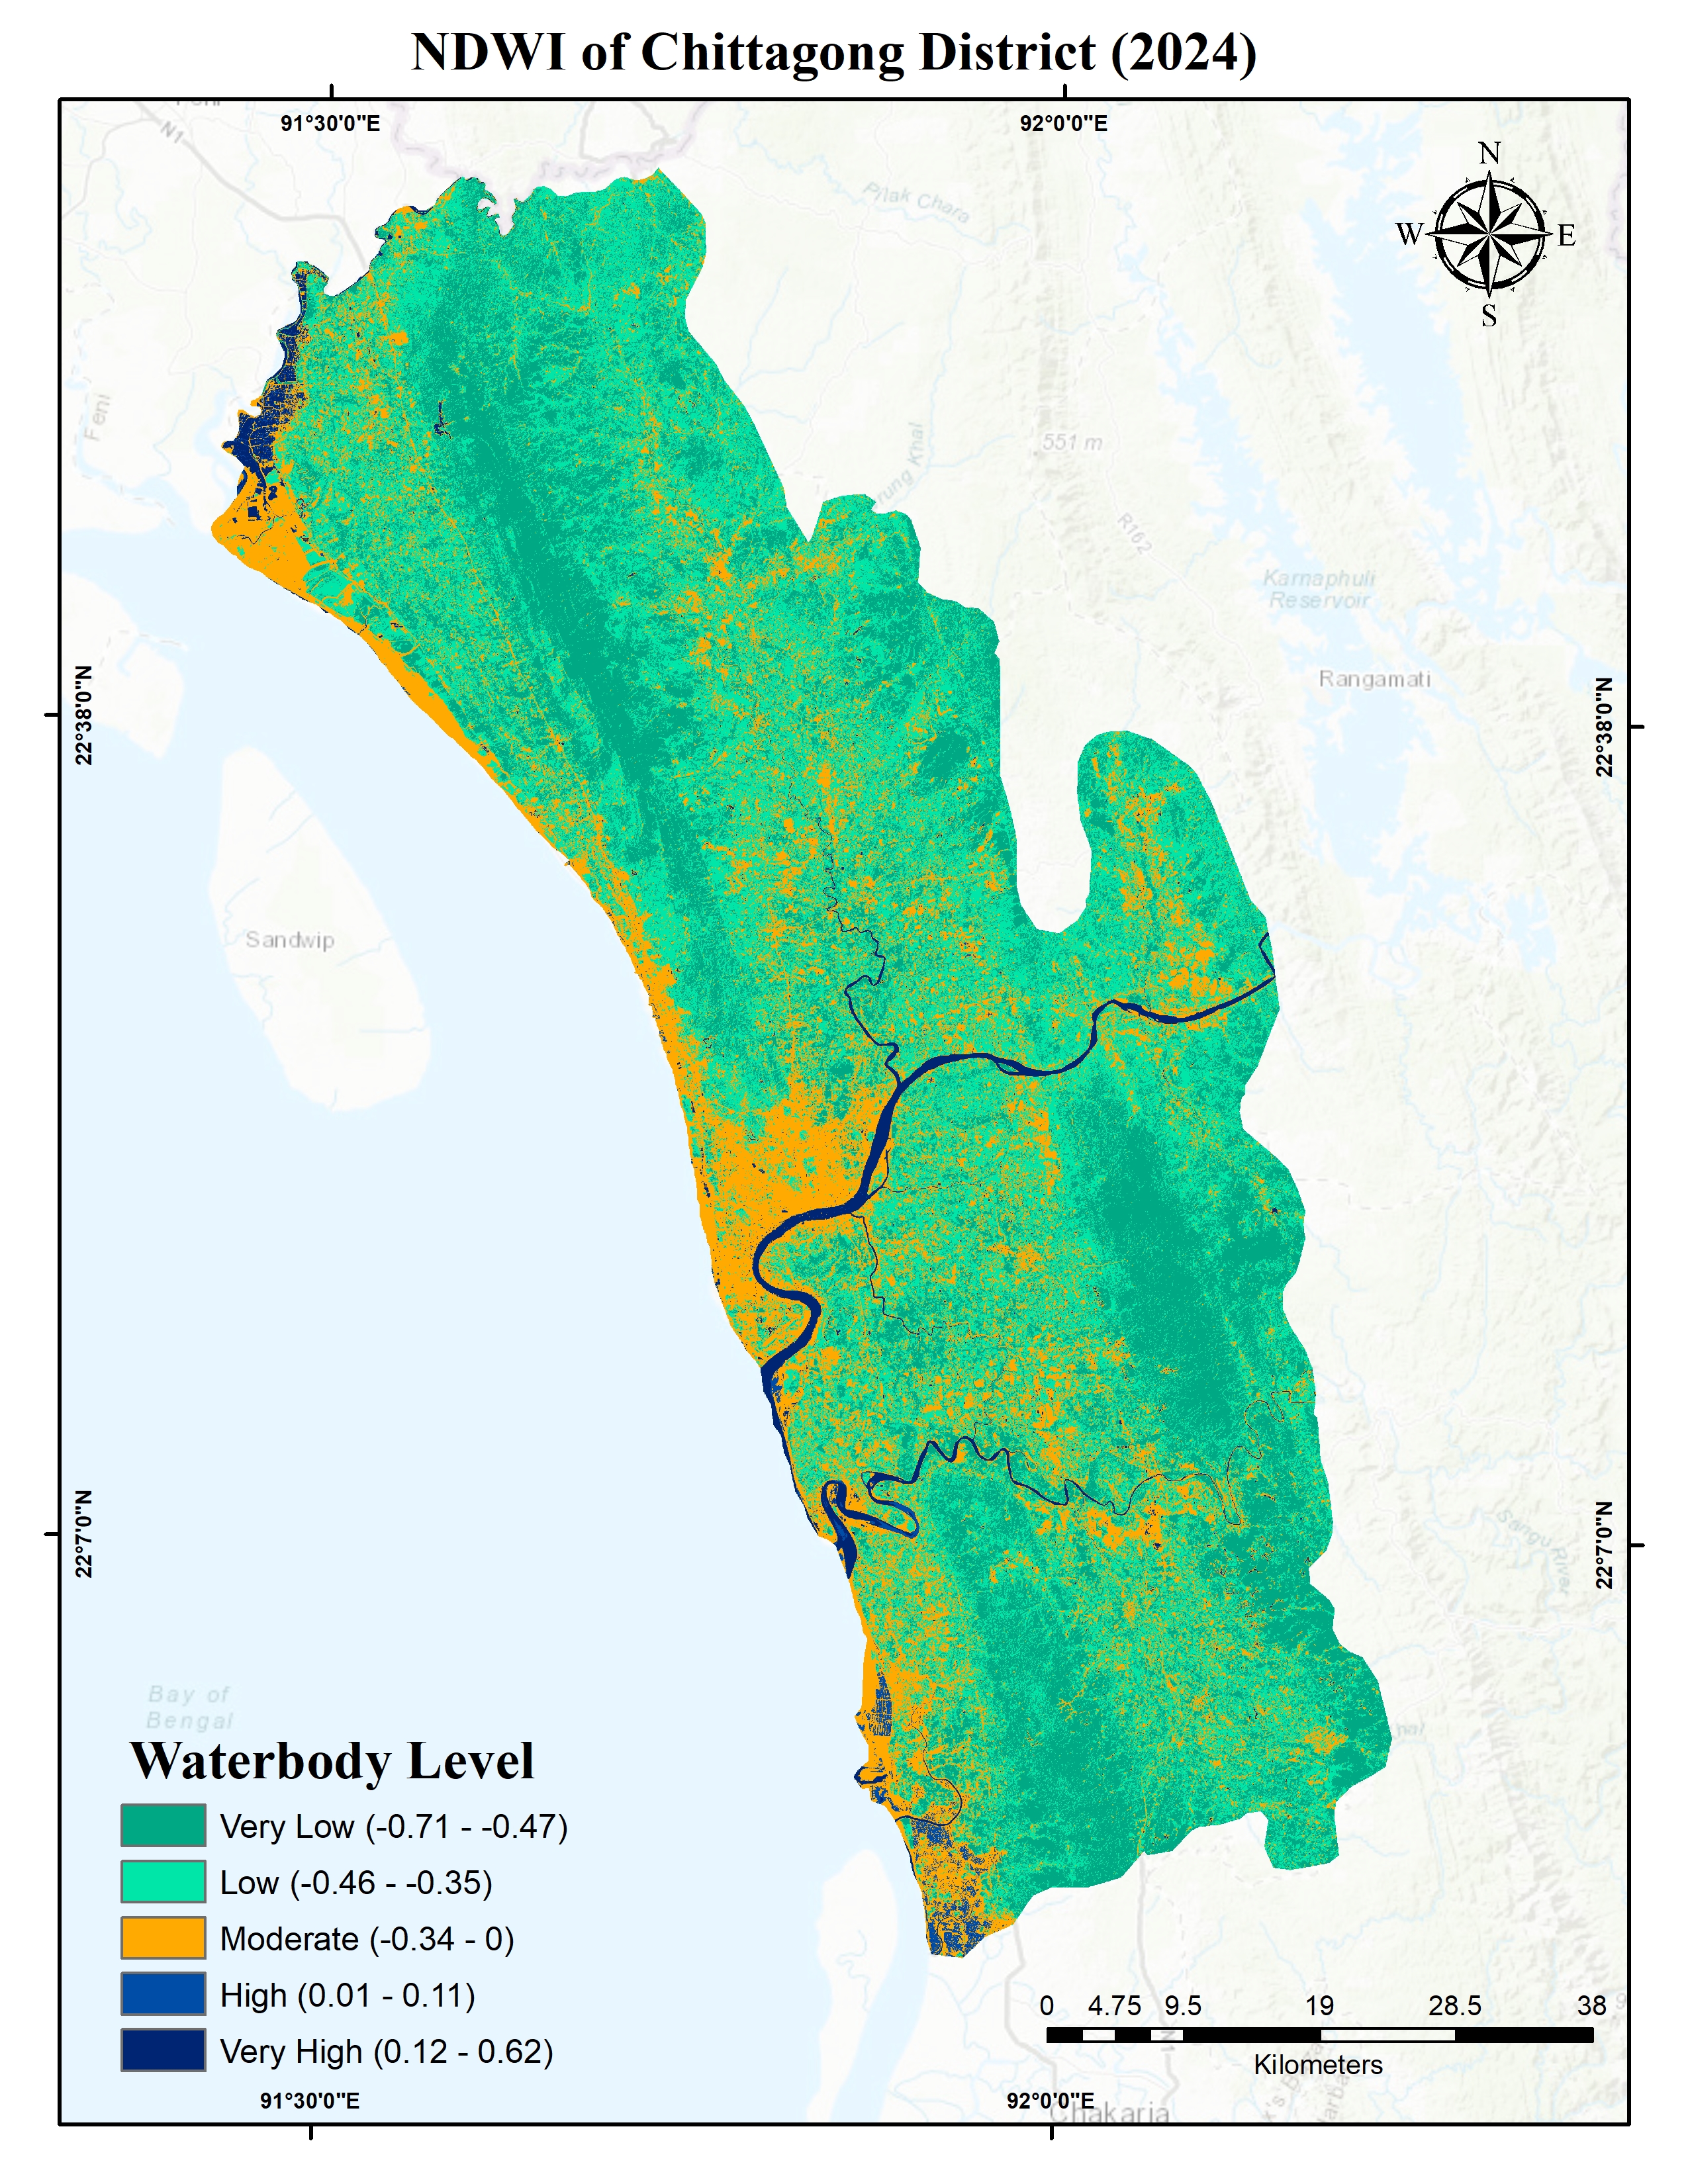
NDWI is commonly used to delineate open-water features by comparing green and near-infrared reflectance. It supports the identification of rivers, water bodies, and areas potentially affected by inundation.
The NDWI map illustrates the spatial distribution of water-related features across Chittagong District, including its river networks, coastal areas, and other surface-water features. Areas with relatively high NDWI values may correspond to open water, while lower values generally represent non-water surfaces. The index can support water-resource assessment and flood-related studies, although shadows and built-up surfaces may sometimes complicate water extraction.
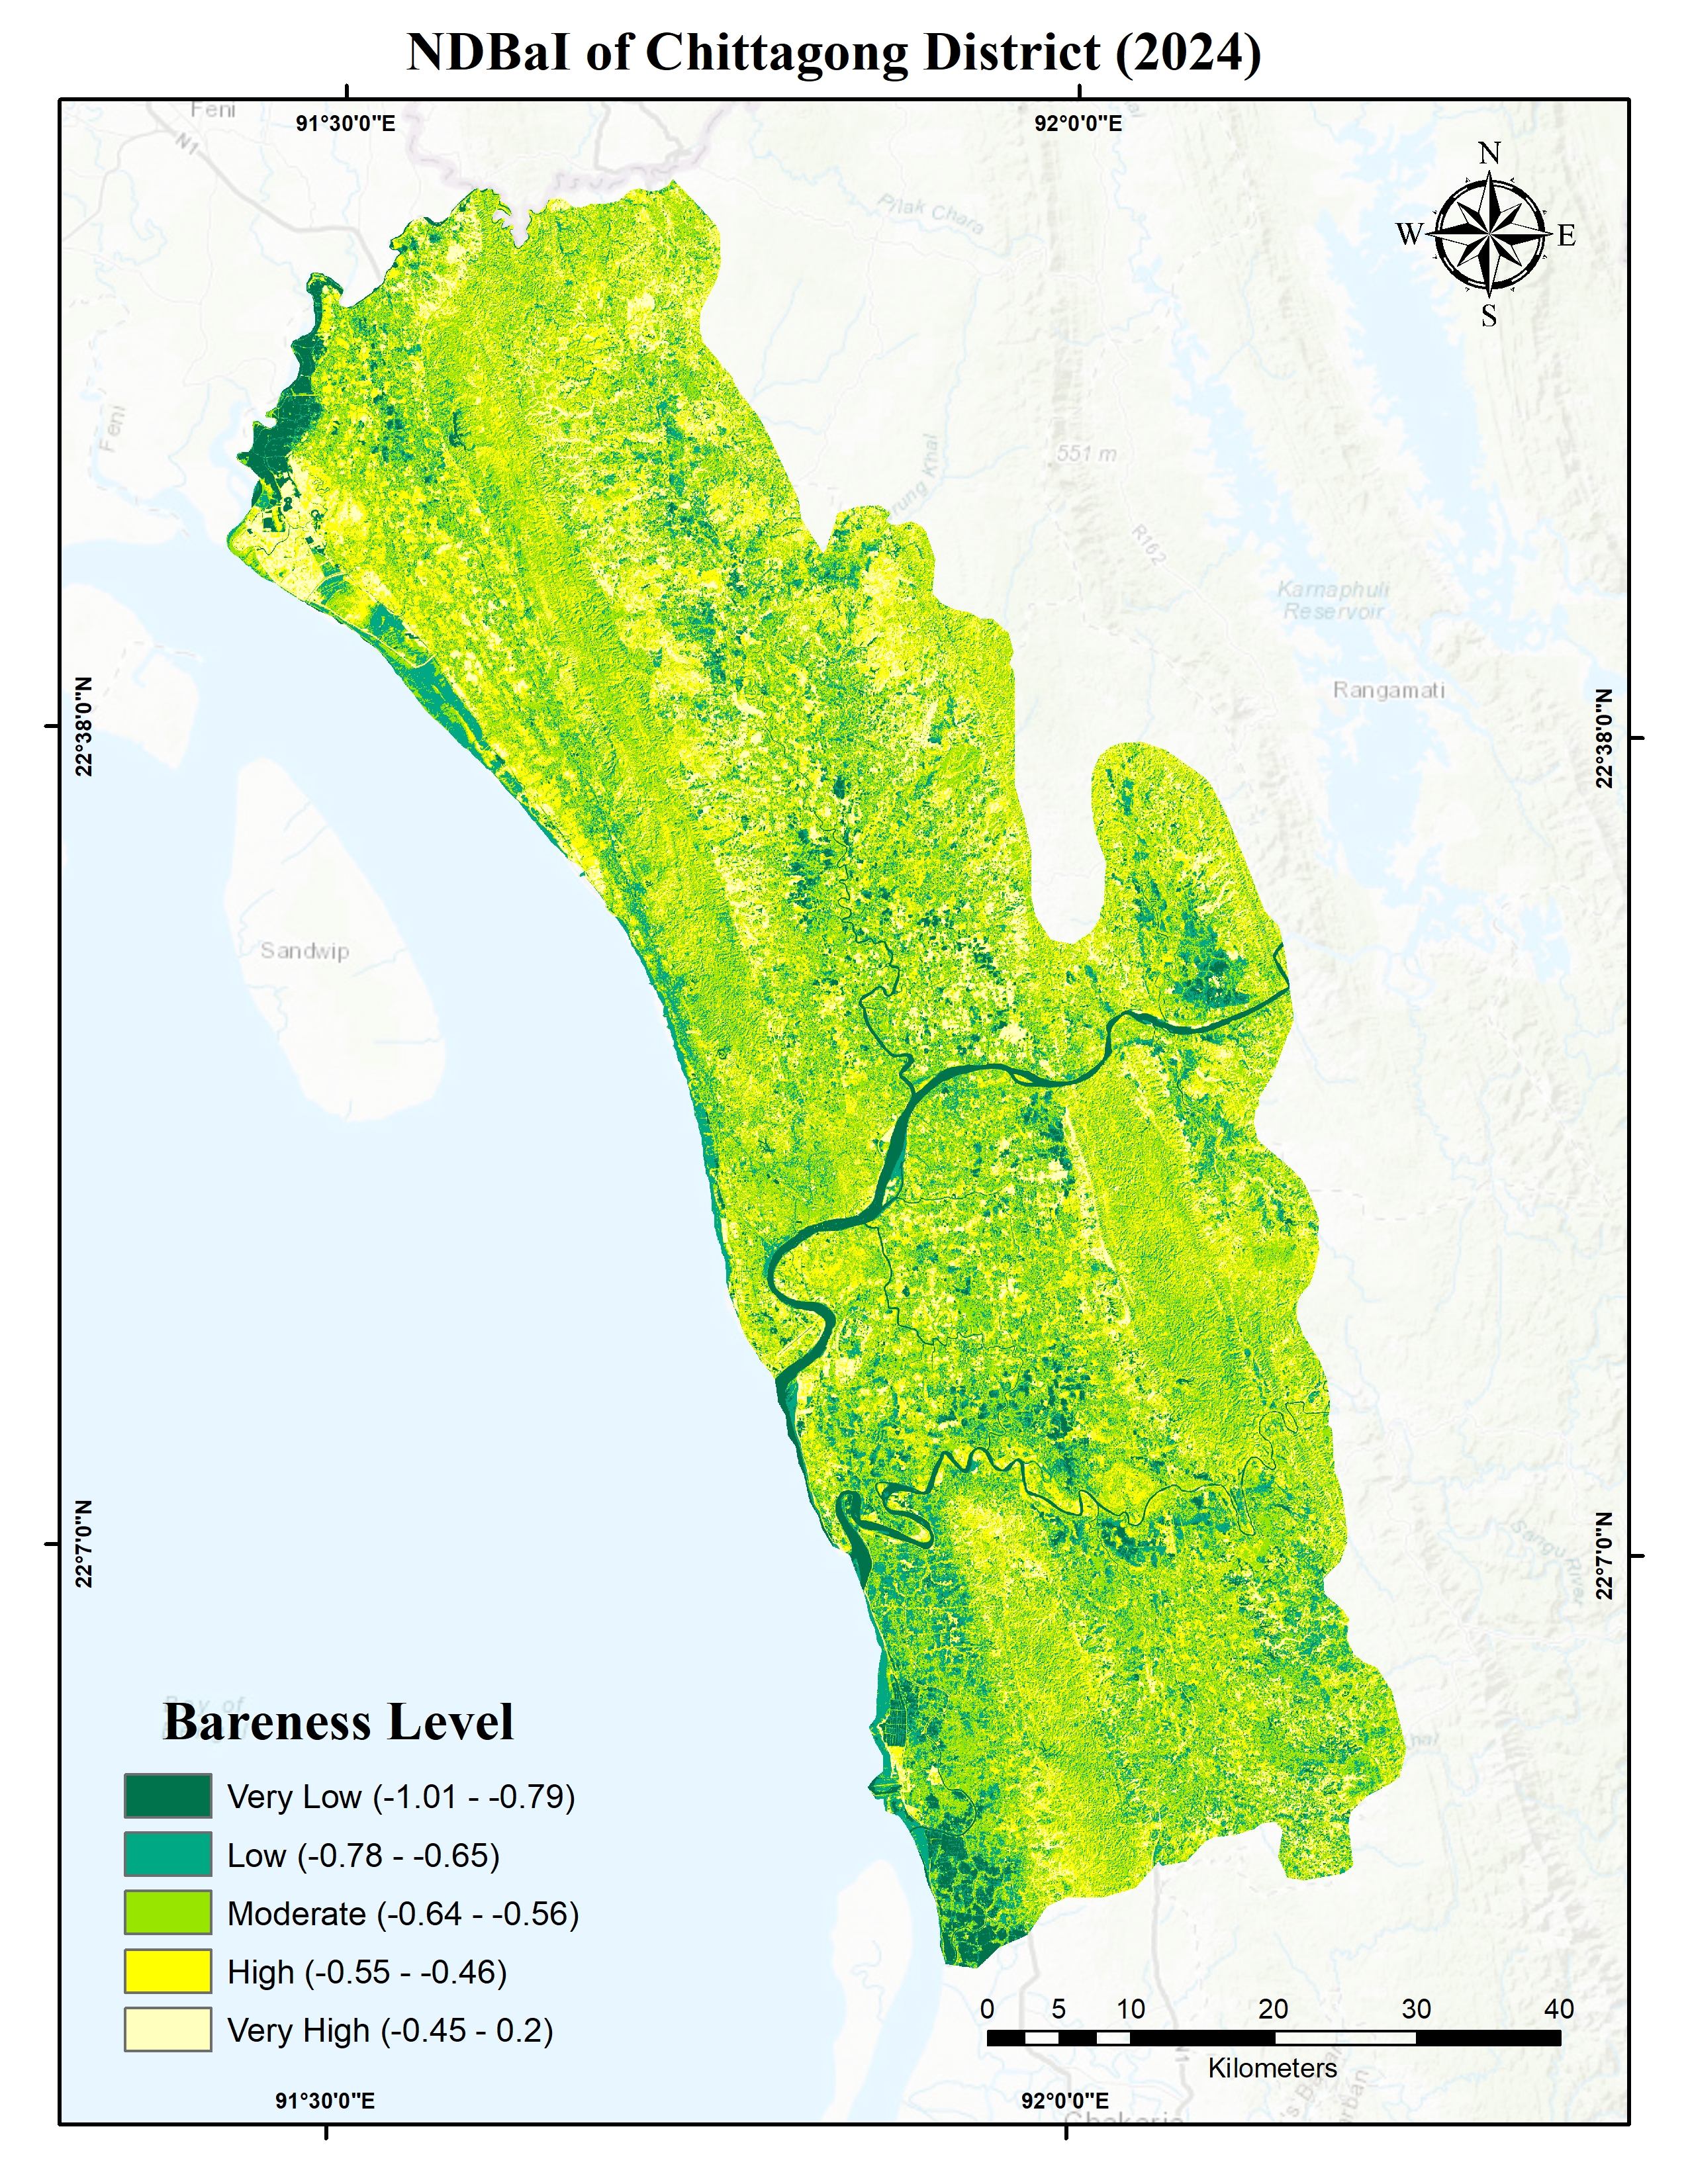
4. Normalized Difference Bareness Index (NDBaI)
NDBaI is a spectral index used to characterize bare or exposed land surfaces. Depending on the formulation and satellite sensor, it combines shortwave-infrared and thermal-infrared information to distinguish relatively bare surfaces from other land-cover types. It is useful in studies of land degradation, exposed soil, and surface thermal conditions.
The NDBaI map shows substantial spatial variation in the classified bareness levels across Chittagong District. Areas in the high and very high categories indicate surfaces with relatively stronger bare-surface index responses, whereas low and very low categories indicate different spectral responses that may be associated with vegetation or other surface characteristics. These patterns should be interpreted alongside NDVI, NDBI, and NDWI because spectral responses can overlap among land-cover types.
Together, these indices provide complementary information about land-surface characteristics and demonstrate how satellite remote sensing and GIS can support environmental monitoring, land-cover assessment, and spatial planning. Combining the indices can improve interpretation, although rigorous land-cover identification would require additional data or validation.
Map Creation Workflow:
- At first, remote sensing dataset (Landsat8) dataset were obtained from the USGS website.
- Then those multispectral images were merged using mosaic to new raster tool of ArcGIS
- Clip the image to Chittagong district’s geographic boundary.
- Use Raster calculator to compute each indices form the appropriate Landsat8 bands.
- Classify using symbology (five classes created for readability)
- Finally, design the map by adding title, legend, and coordinates.
Tools: ArcGIS · Remote Sensing · GIS · Spectral Indices · Spatial Analysis · Thematic Mapping